02 — The Engine
Profiling
Attach a profiler before you touch a line of code. The slow part is almost never where you think it is.
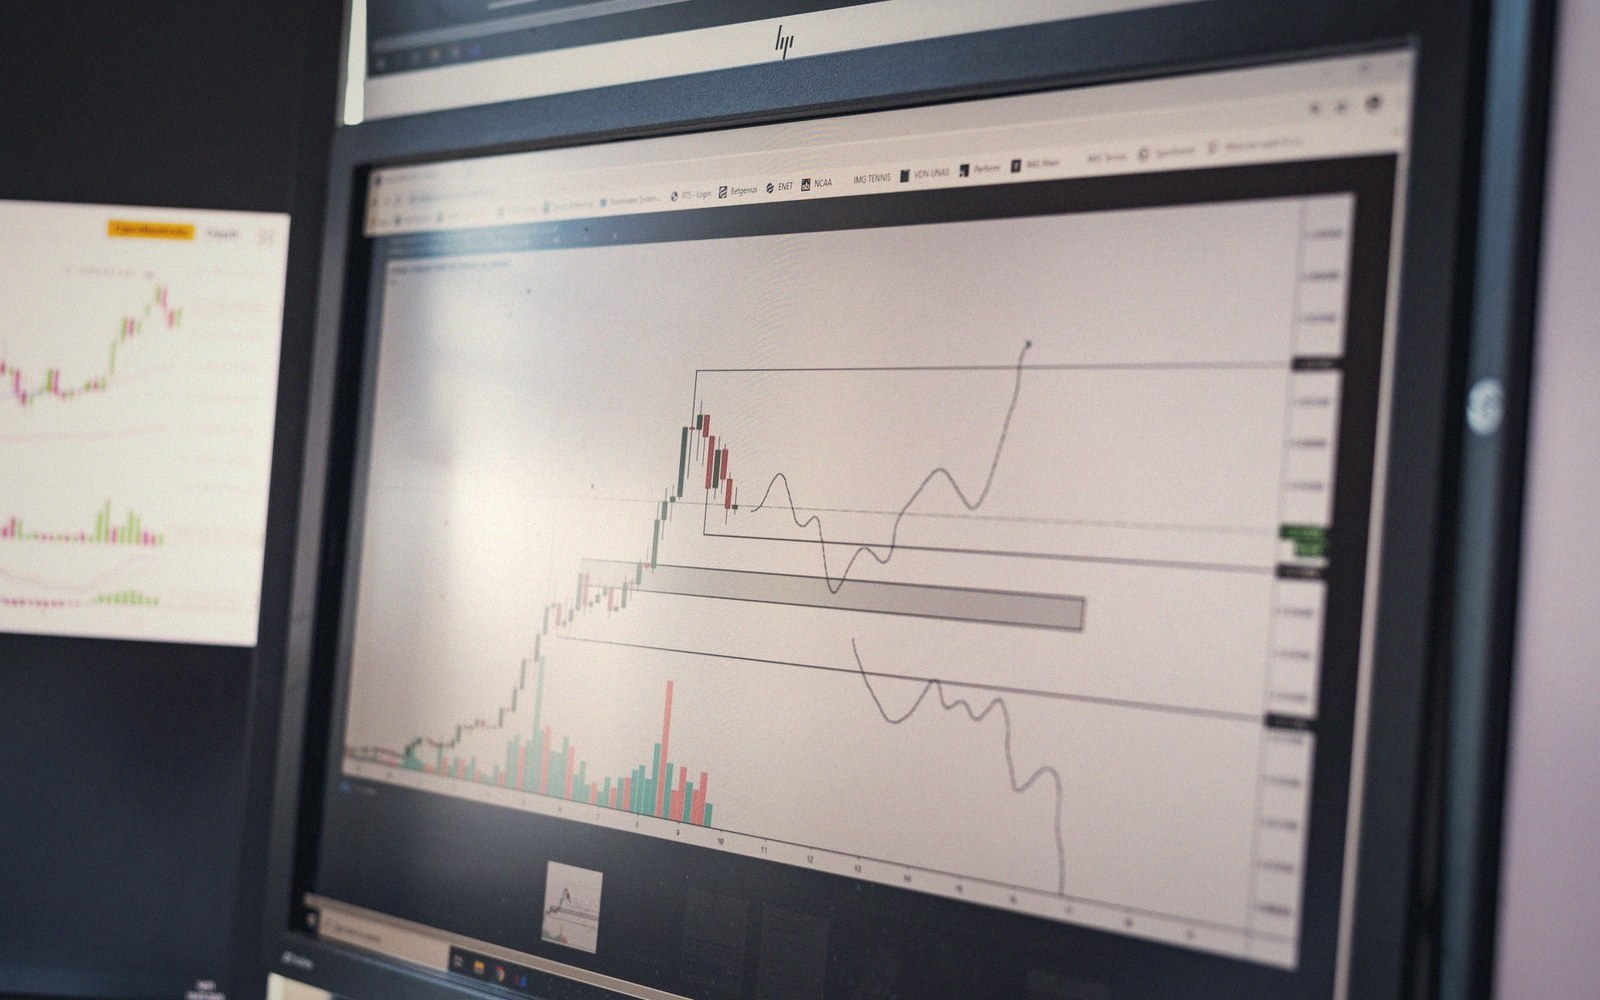
Measured rather than guessed. The expensive pass is rarely the one anybody suspected.
Photo: AlphaTradeZone / Pexels
Why your guess is wrong
A frame feels slow, so the programmer tightens the particle system. The frame stays slow. Three days later someone runs a profiler and finds the bottleneck was a physics query happening six hundred times per tick because a loop counter was off by one. The particle work is irretrievably done and the frame is still slow.
This is the standard story. Intuition about where time goes is shaped by what code you recently wrote, what you understand best, and what you're most afraid of — none of which correlates well with what the CPU or GPU is actually waiting on. The profiler doesn't have opinions. It measures.
Every major engine ships a profiler or integrates cleanly with one. Unreal's Insights tool and Unity's Profiler window both surface per-frame timings, thread occupancy, and memory allocation spikes without requiring instrumentation of every system. External tools — RenderDoc for GPU work, Intel VTune, Superluminal, Razor GPU for PlayStation targets — go deeper when the in-engine view isn't granular enough. The choice of tool matters less than the habit of using one before any optimisation pass begins.
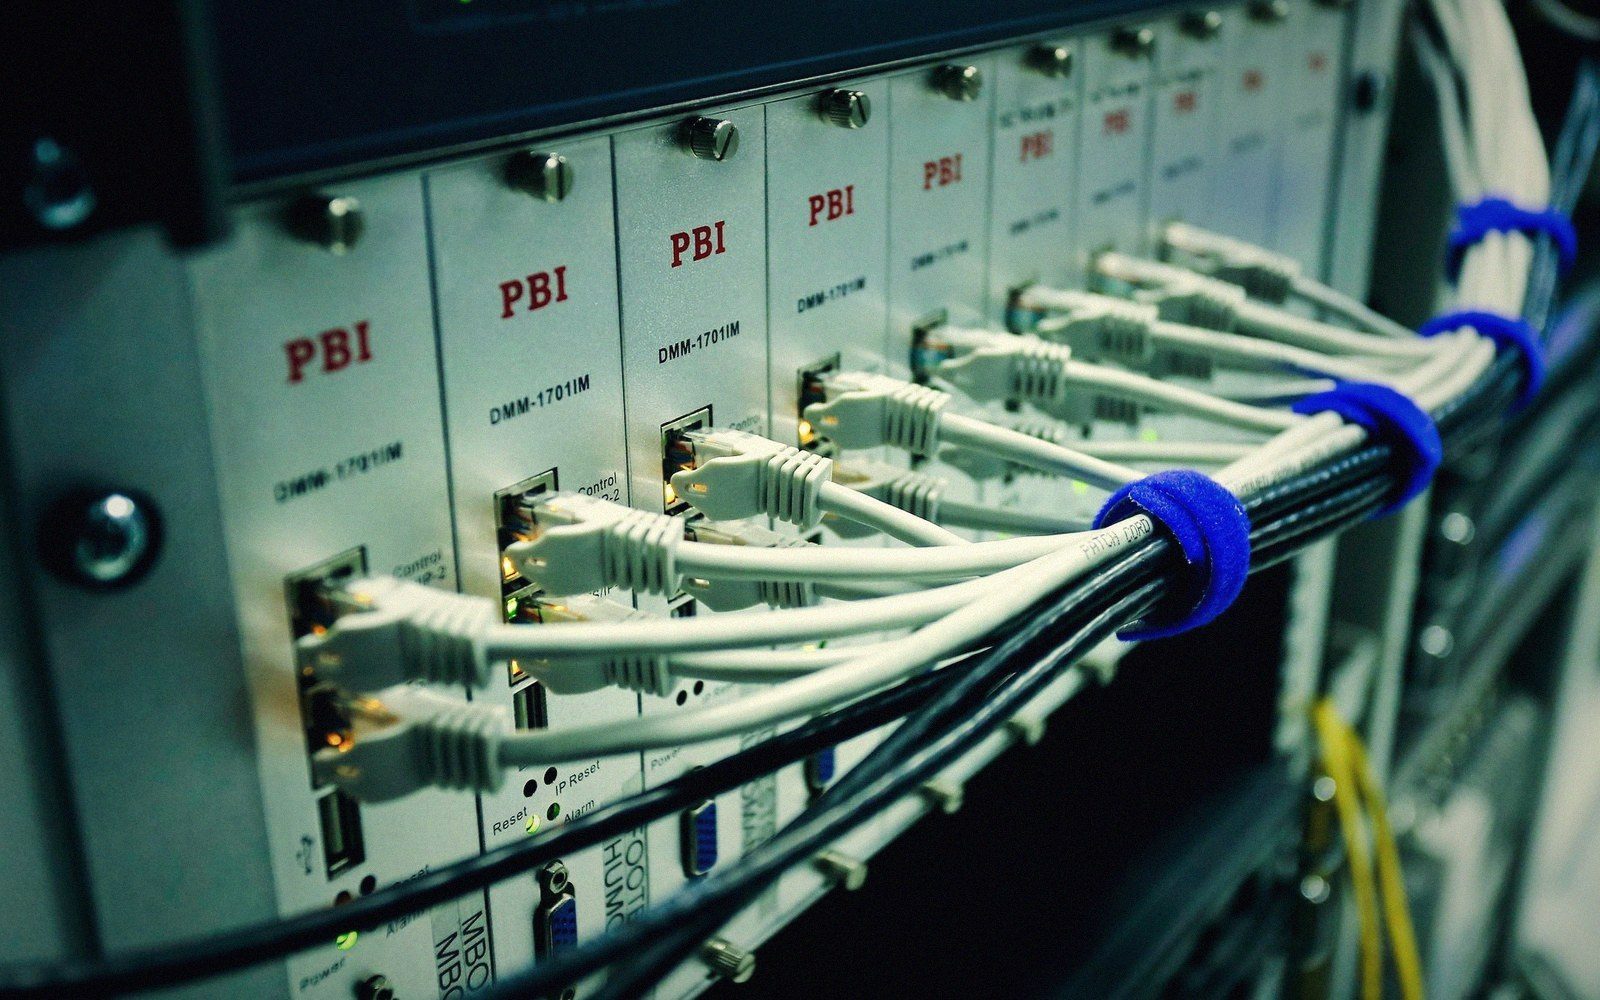
Development hardware for every supported target. The weakest machine in the rack sets the design.
Photo: Sergei Starostin / Pexels
What profiling actually finds
A profiler attached to a real scene on real target hardware will typically surface a few categories of surprise. Draw call counts are a common culprit: a scene that looks modest in the editor can issue thousands of batches once dynamic objects, UI elements and transparent surfaces are counted separately. Garbage collection spikes on managed runtimes — Unity's Mono and IL2CPP builds both — show up as sudden flat lines where every thread stalls. Unbalanced workloads across CPU cores appear as threads sitting idle while one thread is overloaded. Shadow map updates that were assumed cheap turn out to be expensive every frame.
None of these are exotic. All of them are invisible without measurement. The profiler also tells you the shape of the problem over time: a hitch that happens every four seconds is different from a constant 2 ms overhead, and they require different fixes.
The choice of tool matters less than the habit of using one before any optimisation pass begins.
The discipline the profiler enforces is useful beyond performance. Attaching one early in development, before the game is anywhere near its frame budget, builds a baseline. Later, when optimisation passes are scheduled, there is a reference point — so the team can see not just where the frame is being spent today, but which systems have grown more expensive since the last time anyone looked.
Measure first. The answer is almost always somewhere you weren't planning to look.
The frame as measured rather than as designed — usually an unglamorous answer.
Photo: AlphaTradeZone / Pexels